WooCommerce Dashboard Analytics in Shop Manager
The first screen you see when you open Shop Manager is Dashboard Overview: revenue, orders, average order value, new customers, and the charts underneath. This page explains what each number means.
To get there, open yoursite.com/sm-dashboard/ or click Dashboard in the sidebar. If you are an employee rather than an admin, your role needs the View Analytics permission to see revenue and charts.
Choosing a Time Period
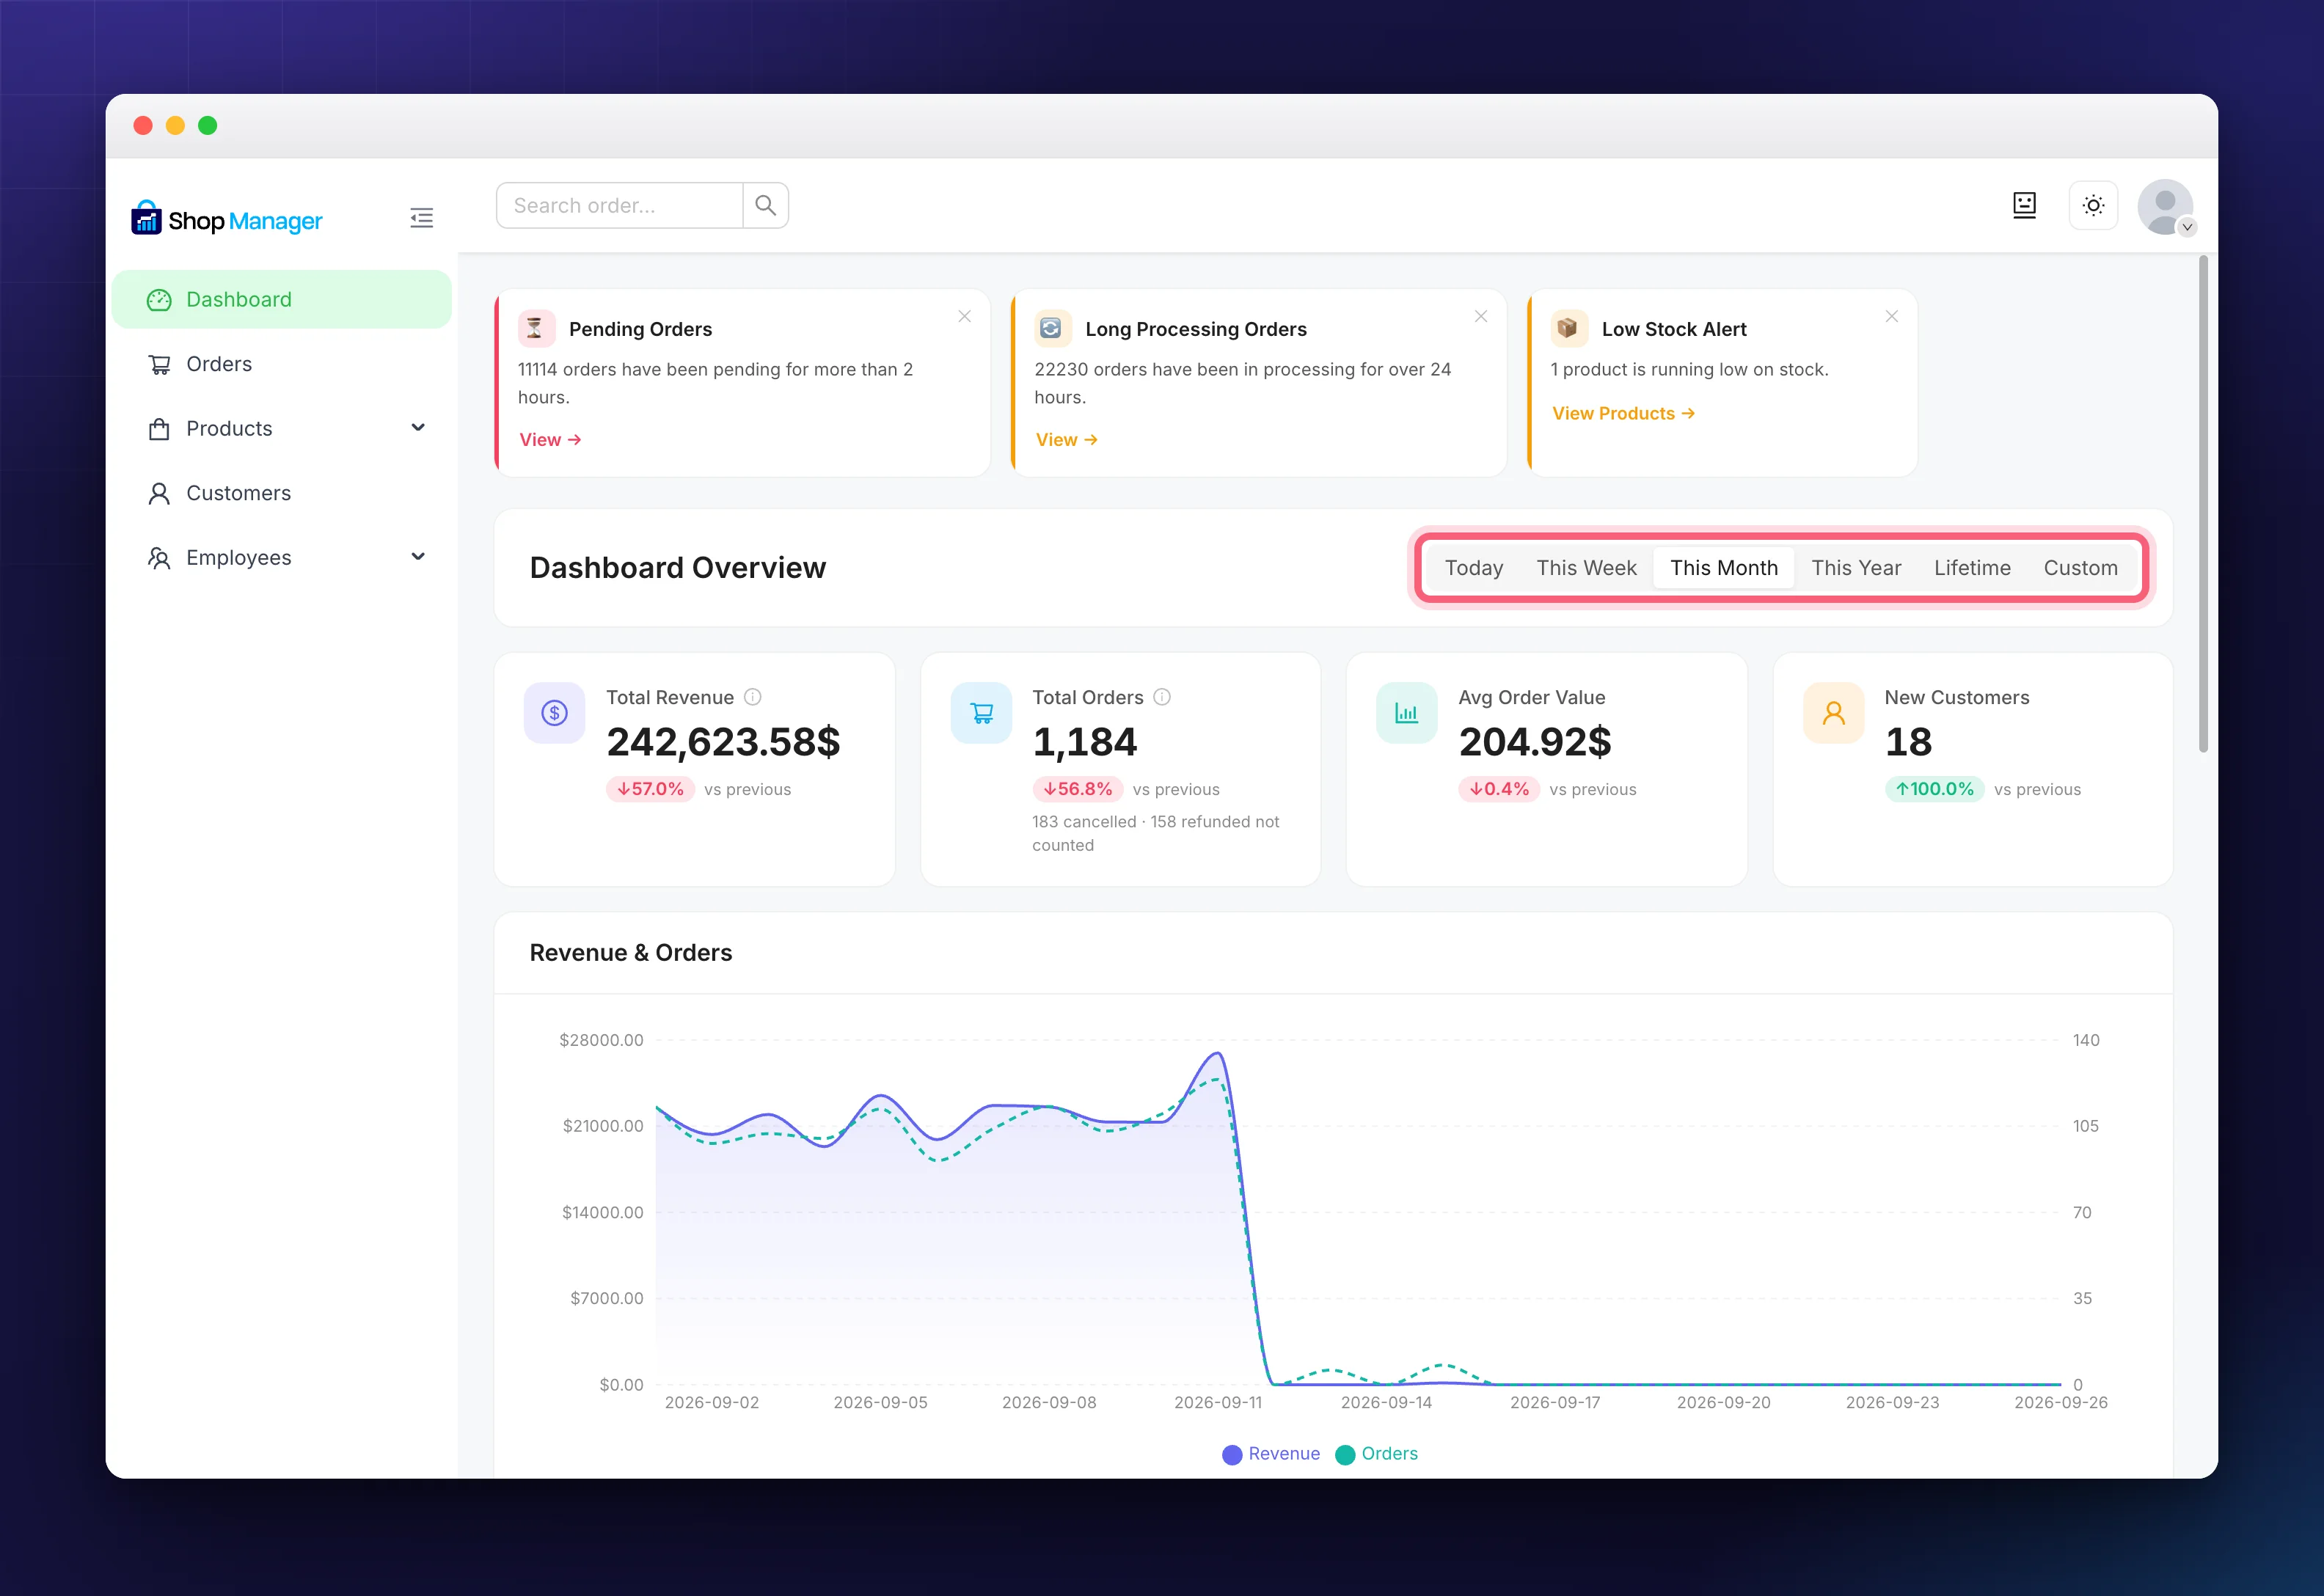
The period selector sits on the same row as the Dashboard Overview heading, with the active period highlighted. Choose Today, This Week, This Month (the default), This Year, Lifetime, or Custom for your own dates. Whichever you pick applies to every number and chart below it.
The Four Headline Numbers
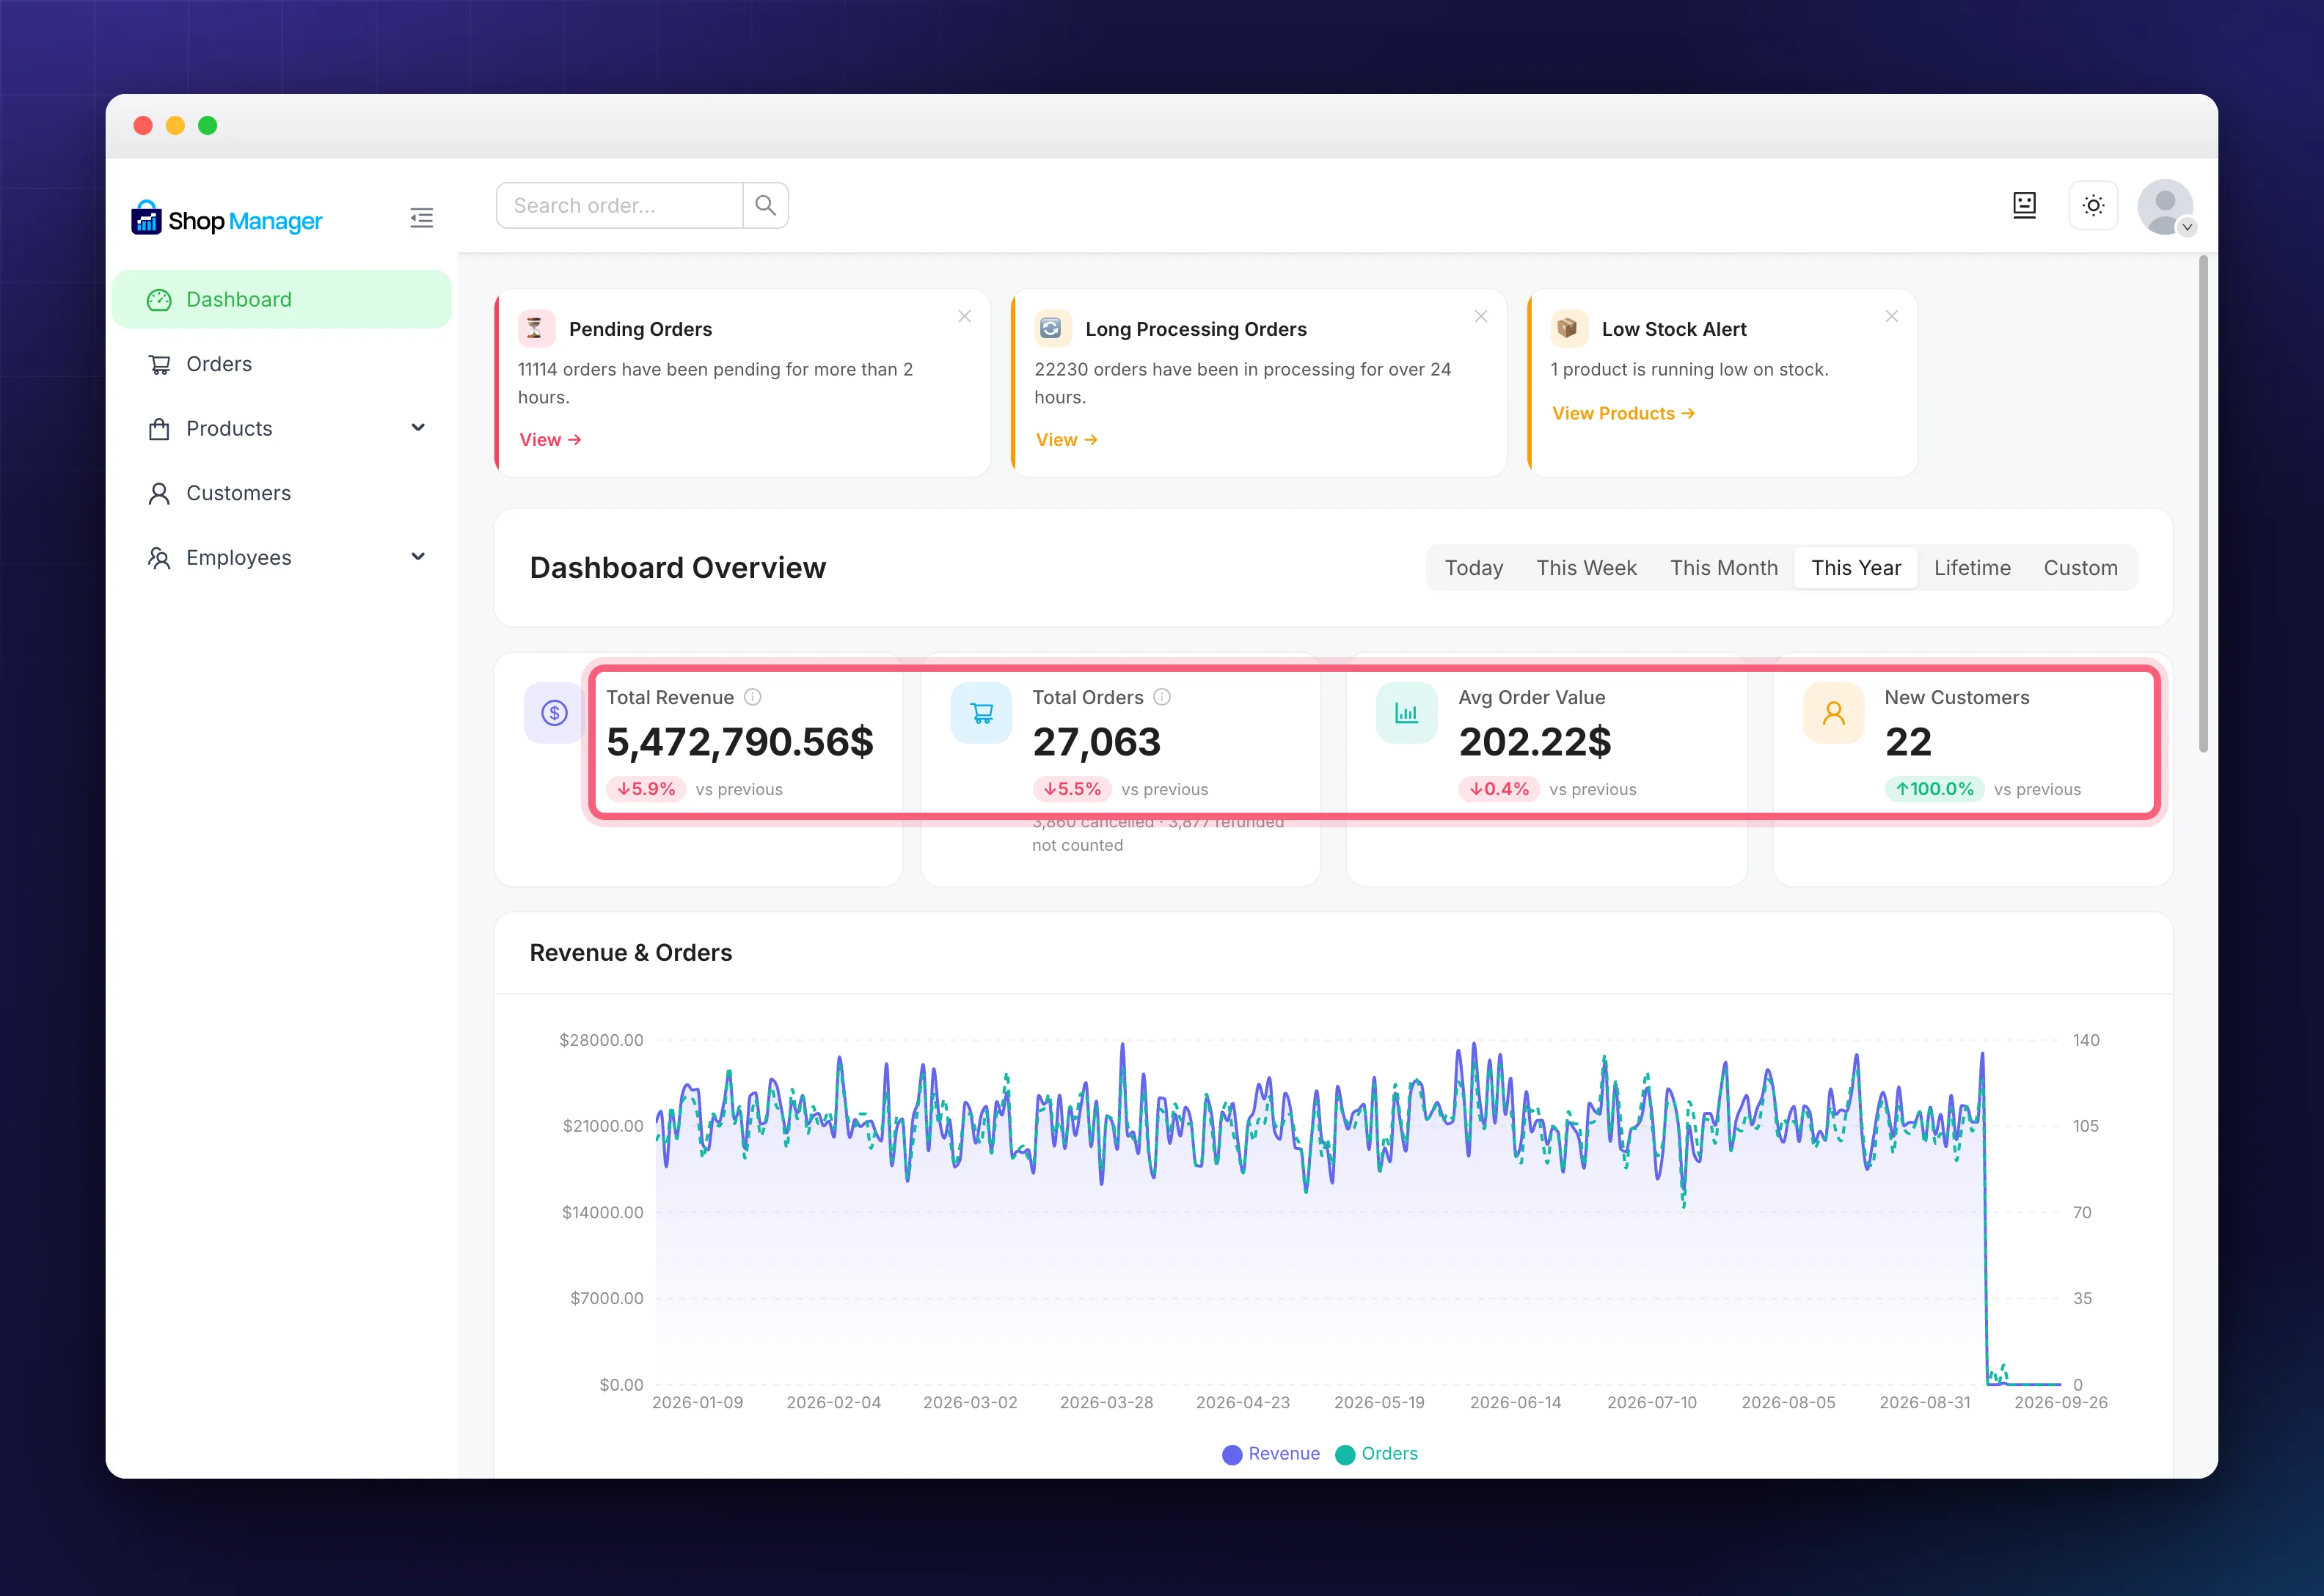
- Total Revenue: what your store earned in the selected period.
- Total Orders: how many orders were placed. The card also notes how many were cancelled or refunded and therefore left out.
- Avg Order Value: revenue divided by orders, often shortened to AOV.
- New Customers: how many first-time buyers you gained.
Each card carries a green ▲ or red ▼ badge and the words vs previous, so you always know what the percentage is measured against: the period immediately before the one you are looking at.
The Charts
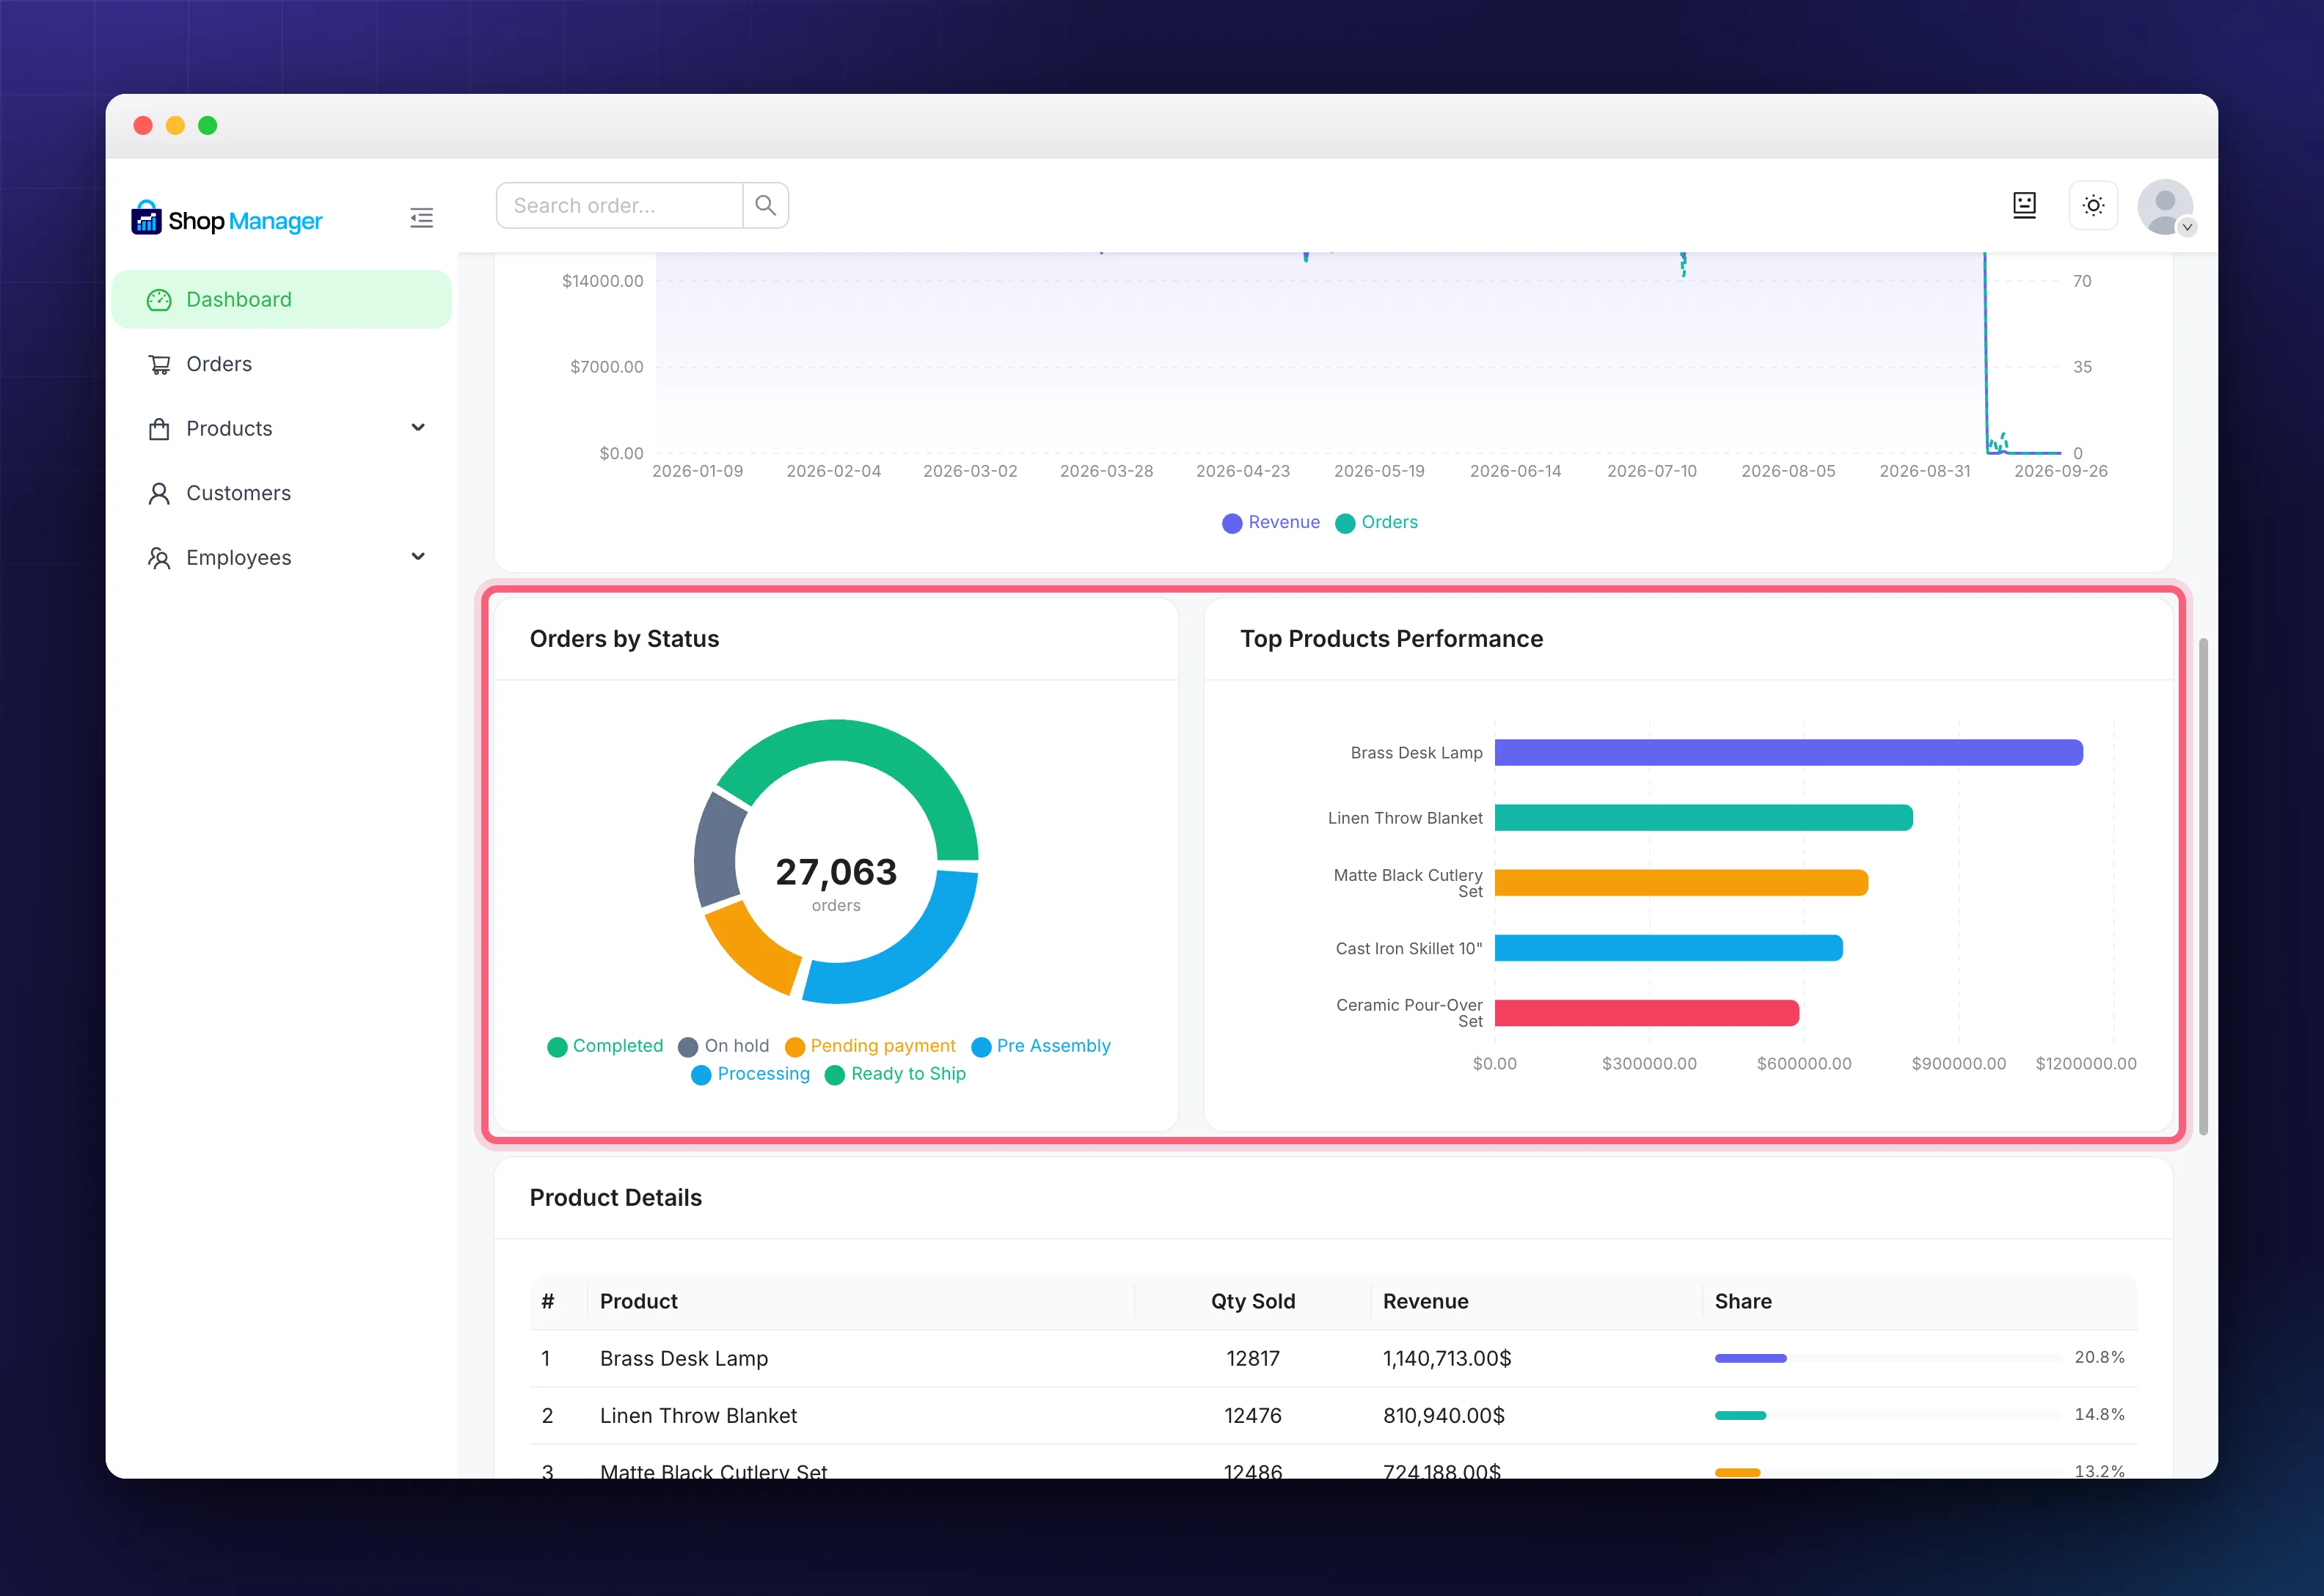
- Revenue & Orders: a line chart of revenue and order count over time, for spotting trends and busy days.
- Orders by Status: a donut with the total order count in the centre, colour-coded by status underneath, including any custom statuses you have created.
- Top Products Performance: a bar chart ranking your best sellers by revenue.
The Tables
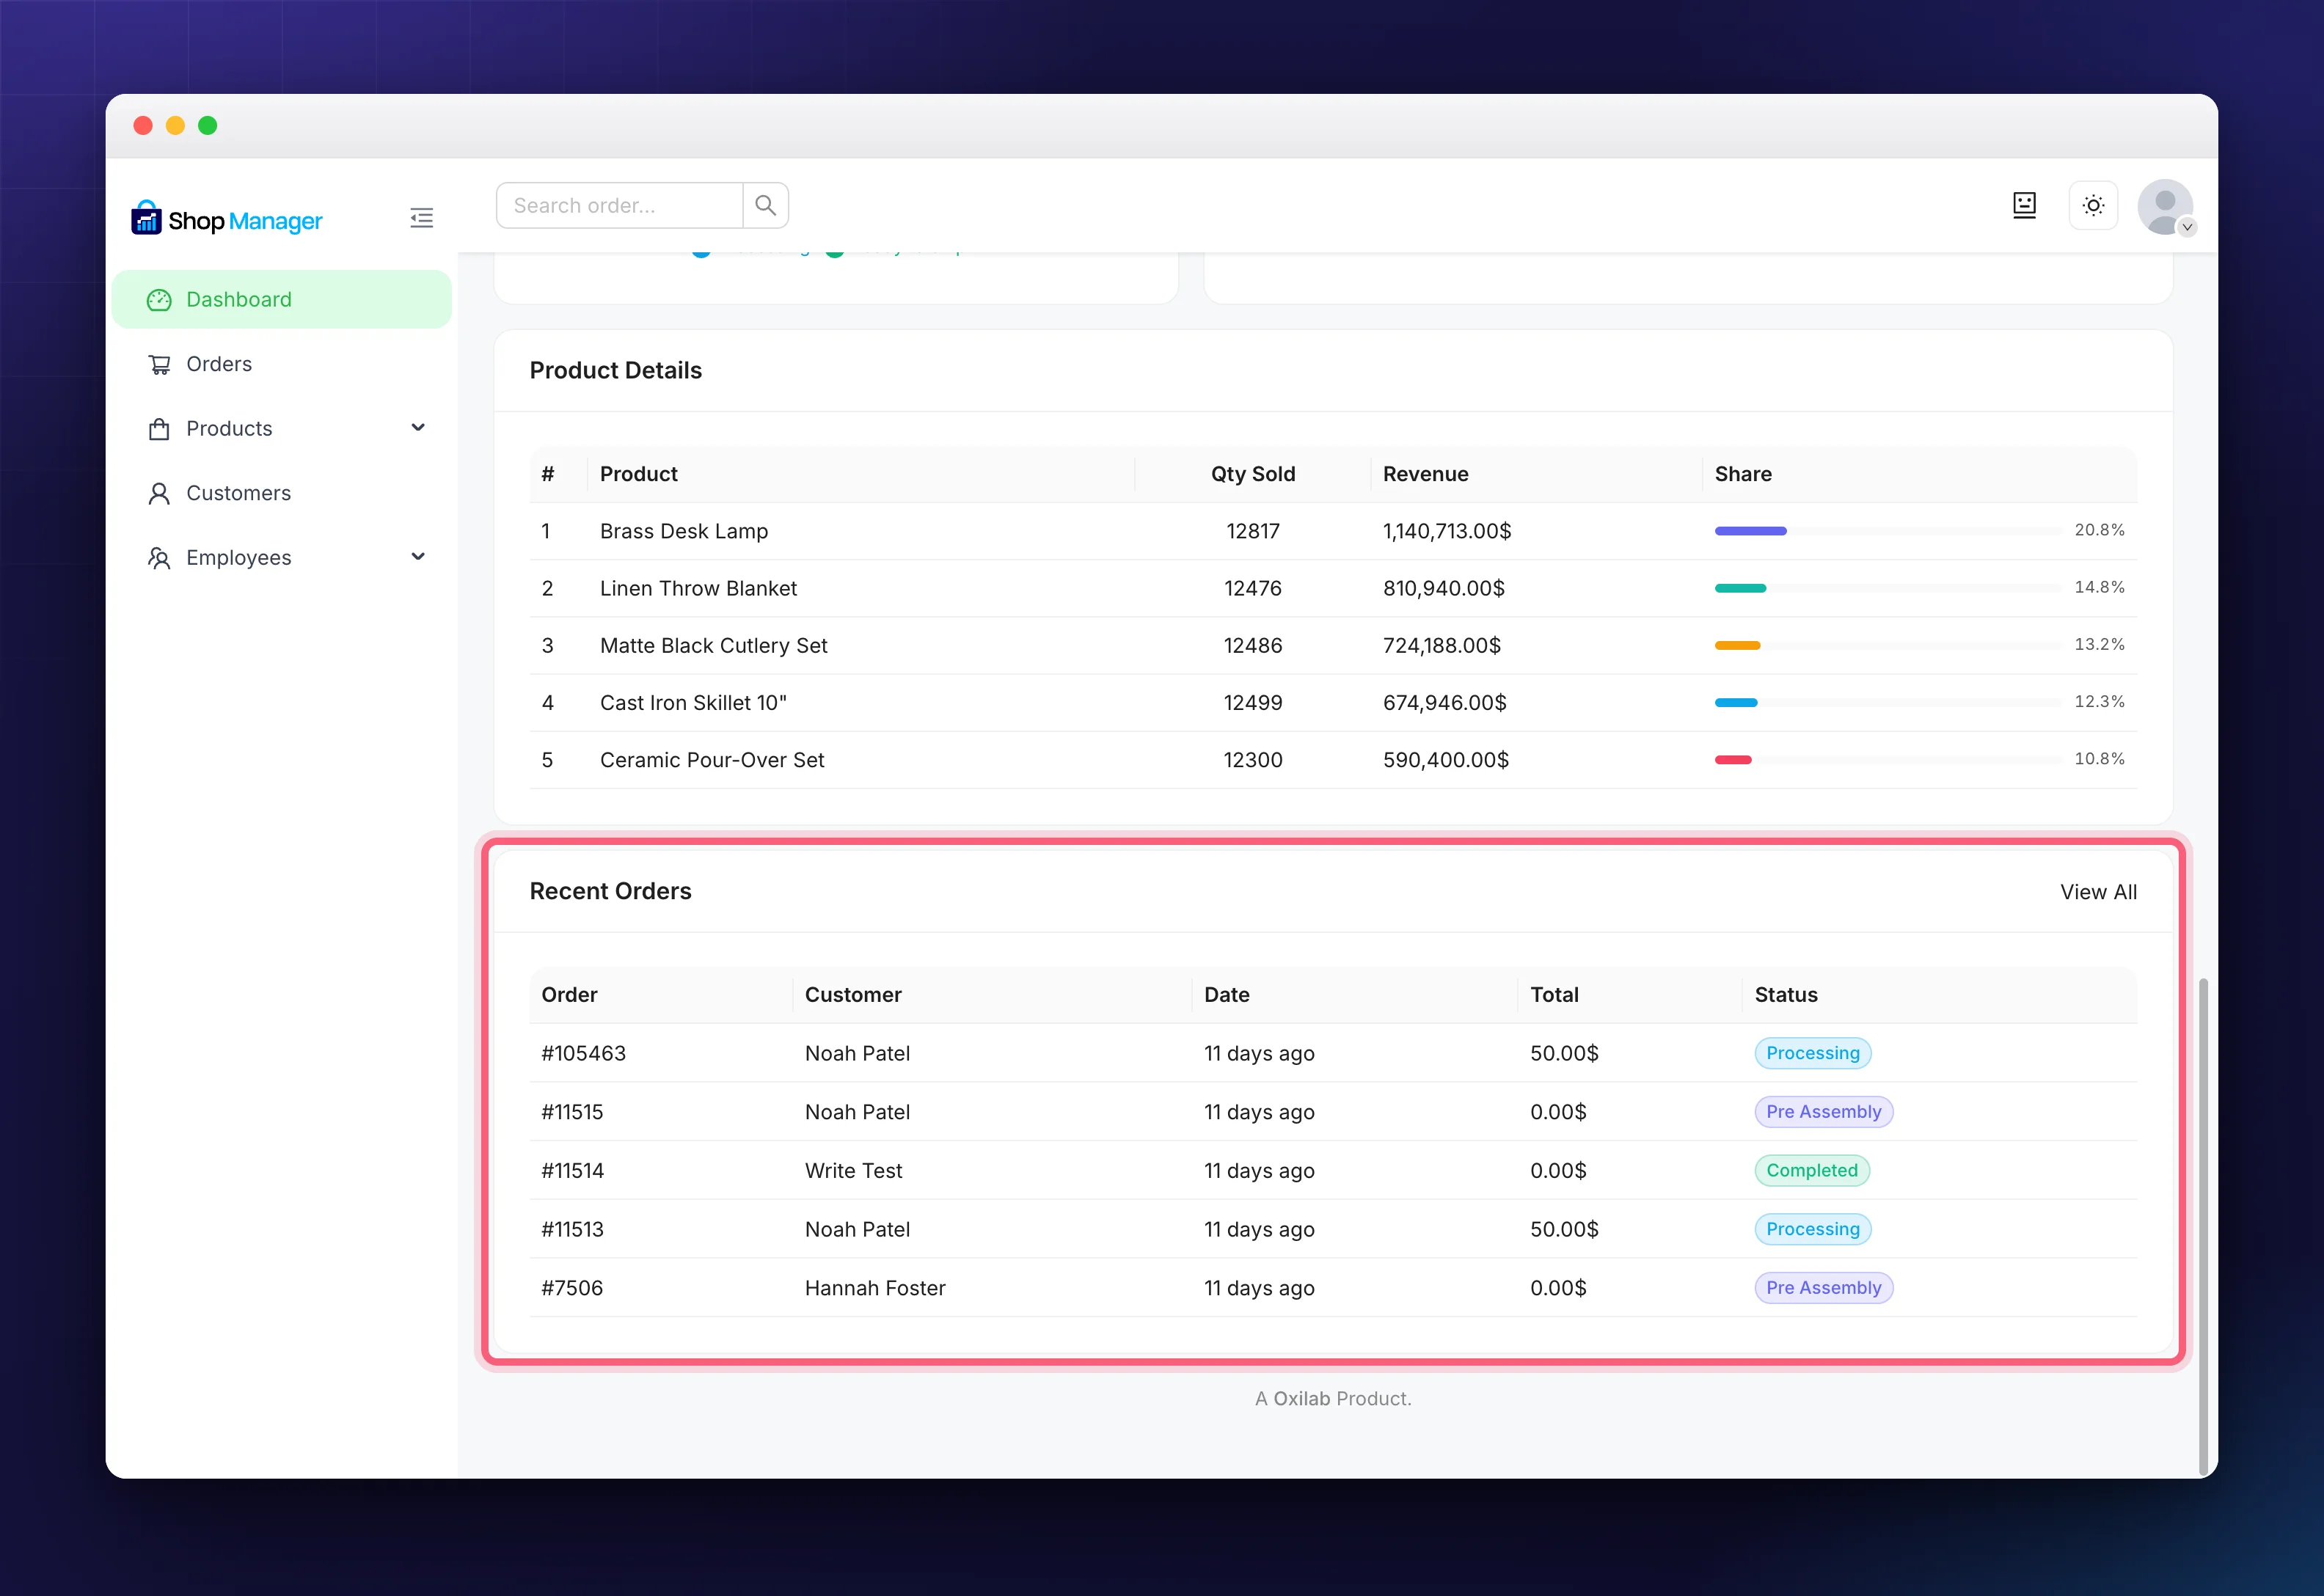
Product Details repeats the top-product ranking with exact quantities, revenue and each product’s share of the total. Recent Orders closes the screen with your latest orders, and its View All link opens the full order list. In both tables, clicking a product or order number opens it.
How Fresh the Numbers Are
The figures are read from your store each time you open the screen or change the period, and the page refreshes itself every five minutes while you leave it open. There is no long cache, so what you see is close to live.
Above these numbers you may also see coloured insight cards flagging things that need attention.
Troubleshooting
Every number is zero.
Check the period first. You may be on Today with no orders yet. Switch to This Month or Lifetime to confirm.
The charts spin and never load.
Reload the page, clear any caching plugin, and check you are logged in with a role that has analytics access.
Revenue looks wrong.
Confirm the dates you are comparing, and remember that cancelled and refunded orders affect the totals. Test orders left in the store will skew everything, so clear them out.
Frequently Asked Questions
Does this match WooCommerce’s own Analytics reports?
The figures come from the same order data, but the layout and periods are Shop Manager’s own. Small differences can appear because each tool defines periods and statuses slightly differently.
Which time zone are the dates based on?
Your WordPress site’s time zone, set under Settings → General.
Can my employees see this?
Only with the View Analytics permission on their role, which you control in Roles & Access.
Related Documentation
- Dashboard Insight Cards: the alerts above these numbers.
- WooCommerce Order Management: the orders behind the figures.
- All dashboard and analytics guides